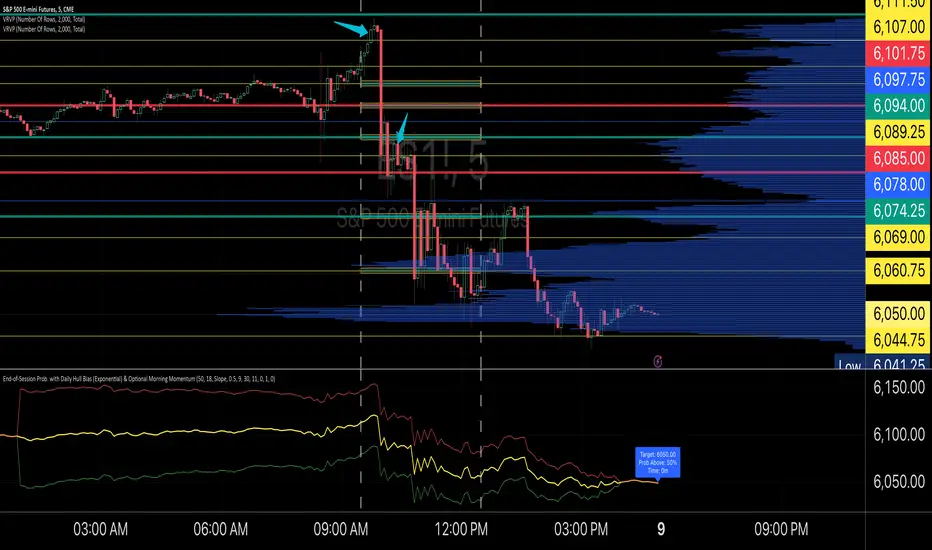
End-of-Session ProbabilityThis indicator estimates the probability that the market will finish the session above a specified target price. It blends a statistical probability model with directional bias and optional morning momentum weighting to help traders gauge end-of-day market expectations.
Key Features:
• Statistical Probability Model:
Uses a normal distribution (with a custom normal CDF approximation) scaled by the square-root-of-time rule. The indicator dynamically adjusts the standard deviation for the remaining session time to compute a z‑score and ultimately the probability that the session close exceeds the target.
• Directional Bias via Daily HullMA (Exponential):
A daily Hull Moving Average (calculated using an exponential method) is used as a big-picture trend indicator. The model allows you to select your bias method—either by comparing the current price to the daily HullMA (Price method) or by using the HullMA’s slope (Slope method). A drift multiplier scales this bias, which then shifts the mean used in the probability calculations.
• Optional Morning Momentum Weight:
For traders who believe that early session moves provide useful clues about the day’s momentum, you can enable an optional weighting. The indicator captures the percentage change from the morning open (within a user-defined time window) and adjusts the expected move accordingly. A multiplier lets you control the strength of this adjustment.
• Visual Outputs:
The indicator plots quantile lines (approximately the 25%, 50%, and 75% levels) for the expected price distribution at session end. An abbreviated on-chart label displays key information:
• Target: The target price (current price plus a user-defined offset)
• Prob Above: The probability (in percentage) that the session close will exceed the target price
• Time: The time remaining in the session (in minutes)
How to Use:
1. Set Your Parameters:
• Expected Session Move: Input your estimated standard deviation for the full-session move in price units.
• Daily Hull MA Settings: Adjust the period for the daily HullMA and choose the bias method (Price or Slope). Modify the drift multiplier to tune the strength of the directional bias.
• Target Offset: Specify an offset from the current price to set your target level.
• Morning Momentum (Optional): Enable the morning momentum weight if you want the indicator to adjust the expected move based on early session price changes. Define the morning session window and set the momentum multiplier.
2. Interpret the Output:
• Quantile Lines: These represent the range of possible end-of-session prices based on your model.
• Abbreviated Label: Provides a quick snapshot of the target price, probability of finishing above that target, and time remaining in the session.
3. Trading Application:
Use the probability output as a guide to assess if the market is likely to continue in the current direction or reverse by session close. The indicator can help you decide on trade entries, exits, or adjustments based on your overall strategy and risk management approach.
This tool is designed to offer a dynamic, statistically driven snapshot of the market’s expected end-of-day behavior, combining both longer-term trend bias and short-term momentum cues.
Wyszukaj w skryptach "hull+ma通达信源码"
Mean Reversion Indictor, Based on Standard Deviations Description:
The Reversal Candle Mean Reversion Indicator is designed for traders seeking to identify potential reversal points in the market based on key price action and volatility. This indicator combines price action analysis (sweeping prior highs or lows) with mean reversion theory, highlighting opportunities where the price tests or touches a moving average's standard deviation bands.
By focusing on these moments of price extremes, the indicator helps traders spot bullish and bearish reversal signals when the price retraces from volatile movements. These conditions often signal a return to the mean—an ideal setup for reversal traders who thrive on fading exaggerated price moves.
How It Works:
1. Price Action Reversal Signal:
* Bullish Reversal: The indicator flags a bullish signal when the current candle's low sweeps the prior candle's low, and the candle closes higher than the prior candle's close.
* Bearish Reversal: The indicator flags a bearish signal when the current candle's high sweeps the prior candle's high, and the candle closes lower than the prior candle's close.
2. Mean Reversion Confirmation:
* Mean Reversion Signal is triggered when the price touches or tests the upper or lower bands, calculated using a user-selected moving average (SMA, EMA, WMA, VWMA, or Hull MA) and standard deviation.
* The indicator combines price action and volatility, providing stronger reversal signals when the price reaches an extreme distance from the moving average.
3. Customization Options:
* Moving Average Type: Choose from SMA, EMA, WMA, VWMA, or Hull MA.
* Moving Average Length: Adjust the length of the moving average (default: 20).
* Standard Deviation Multiplier: Set the number of standard deviations for the volatility bands (default: 2.0).
* Custom Candle Colors: Choose custom colors for bullish and bearish reversal candles to easily spot signals.
How to Use for Trading Reversals:
1. Identify Extremes:
* Watch for candles where the price tests or touches the standard deviation bands. These are key moments when the price has moved significantly from the moving average, indicating a potential overbought or oversold condition.
2. Look for Reversals:
* When the price tests a band and simultaneously forms a bullish reversal pattern (sweeping the prior low and closing higher), it signals a potential mean reversion to the upside.
* When the price tests a band and forms a bearish reversal pattern (sweeping the prior high and closing lower), it signals a potential mean reversion to the downside.
3. Entry Points:
* Long Trades: Enter a long trade after a bullish signal appears (green candle) near the lower band, indicating a likely price reversal back towards the mean.
* Short Trades: Enter a short trade after a bearish signal appears (red candle) near the upper band, indicating a likely price pullback.
4. Exit Strategy:
* Set a profit target at the moving average (the mean) or a specific price level based on your strategy.
* Consider using a trailing stop to capture additional profit in case of a stronger reversal beyond the mean.
5. Risk Management:
* Place stops just below the low of the bullish reversal candle or just above the high of the bearish reversal candle to manage risk efficiently.

RMI + Triple HMRSI + Double EVWRSI + TERSI + CMO StrategyThis is a strange experimental strategy WIP that I decided to upload an early version to share some of what I am working on. Just one script of a few.
It combines Chande Momentum with RMI and some weird ones I am experimenting with - Triple Hull MA RSI, Double Exponential + Volume Weighted RSI, Triple Exponential RSI. And to top it off, a final oscillator that combines the THMRSI with the RMI.
The main intention here, currently, is to test the usefulness of each on different timeframes and values. Currently it is considered to buy when all are below their threshold and sell when all are above, with the chande momentum crossing its line as the final confirmation.
For now there is no individual for each of the unique elements included. I am going to likely use this is a working house project to test other experimental indicators in the future.
It may be some of these are better suited for long term but I do think they have valid uses in checking short and long term momentum at the very least.
I copied the RMI from Everget.


Donchian Fibonacci Trading ToolDONCHIAN FIBONACCI TRADING TOOL
This indicator is based on a Donchian Channel with Fibonacci zones I published before. Features are added which enable trading decisions, it suggests when to open either a long or a short position, it provides suggestions for a stop loss level and suggests a take profit level, the calculation of the take profit suggestion can be altered in the inputs. The user should devise a trading strategy on his own, several strategies are possible, but as a Donchian Channel is used, these must come down to refinements in the classical Turtle Trading system.
NO LAGGING
Donchian Channels have no lagging, this tool being based on these, has none as well. The only added feature with a little lagging is the Hull MA, all other features work at once and report right now the historical context of the present bar or candle even while it is developping.
ANY TIME FRAME
This indicator works in any time frame. However, when the user sets the prediction calculation to percent, then in small intraday time frames the result will be relatively huge.
FALSE SIGNALS
Fibonacci retracement levels are based on inclinations which exist in nature and which also exist in the financial markets. The expectations, labeled ‘DFT: expect’, based on these levels, are usually correct. The take profit levels otoh, labeled ‘DFT: predict’, are usually incorrect. The trader should take care and needs proper ‘gut feeling’ in using these
FEATURES TRIGGERED BY THE MARKET ENTERING OR LEAVING ZONES
1. REACTIVE COLORS
The zone in which the close is, is brighter coloured.
2. ENTRY AND EXIT MARKERS NEAR UP- OR DOWN TREND ZONES
If the close enters the Up Trend or Down Trend zone, coming from another zone, a triangle is placed just outside the channel border. If it leaves the zone, an X cross is placed.
3. MARKET SITUATION EXPECTATION LEVELS (OFFSET)
The indicator can report four market situations which may be valid for the last candle:
3.1. Market is in up trend: a blue dot is placed in an offset (=future) position of the High Border,
expect levels are placed offset of High Border and the Highest Fibonacci line,
3.2. Market is in down trend: a red dot is placed offset the Low Border, also expect levels offset the Low Border and the Lowest Fibonacci line.
3.3. Market is high ranging, i.e. last break out was at High Border and market is not in up- or down trend. A green dot is placed offset the Center High Fibonacci line and expect levels offset the Highest and Center Low Fibonacci lines.
3.4. Market is low ranging, i.e. last break out was at Low Border and market is not in up- or down trend. A brown dot is placed offset the Center Low Fibonacci line and expect levels offset the Center High and Lowest Fibonacci lines.
FEATURES TRIGGERED BY AN ATTEMPT TO BREAK OUT OF THE CHANNEL BORDERS
4. SWING LINE
When the High Border is touched, the Swing Line changes its level to the Highest Fibonacci line and changes its color to blue. When the Low Border is touched, the Swing Line changes its level to the Lowest Fibonacci line and changes its color to red. This way you can see whether the general trend is up- or down and also if and when the line has been crossed.
5. DIAMOND MARKERS (OFFSET)
These markers flash when the last bar or candle or the one before that, touches a channel border, the offset is equal to the expect levels.
6. PREDICTION LEVEL (OFFSET)
The prediction level flashes in the same situation as the diamond marker. The default level is 1 Average True Range. Most are in fact false signals. One can switch the prediction level off by setting the added amount to 0, then only the Diamond Markers will flash
OTHER FEATURES
7. HULL MOVING AVERAGE
Its direction provides an indication of the price dynamics.
8. SUPPRESSION OF PLOTTING SOME LAST VALUES
Quite a few lines stop before the last bar or candle. This way the last candle seem free loating and the chart reports only the values the user needs.
Enjoy, Eykpunter.

MA Study: Different Types and More [NeoButane]A study of moving averages that utilizes different tricks I've learned to optimize them. Included is Bollinger Bands, Guppy (GMMA) and Super Guppy.
The method used to make it MtF should be more precise and smoother than regular MtF methods that use the security function. For intraday timeframes, each number represents each hour, with 24 equal to 1 day. For daily, 3 is 3 day, for weekly, 4 is the 4 weekly, etc. If you're on a higher timeframe than the one selected, the length will not change.
Log-space is used to make calculations work on many cryptos. The rules for color changing Guppy is changed to make it not as choppy on MAs other than EMA. Note that length does not affect SWMA and VWAP and source does not affect VWAP.
A short summary of each moving average can be found here: medium.com
List of included MAs:
ALMA: Arnaud Legoux
Double EMA
EMA: Exponential
Hull MA
KAMA: Kaufman Adaptive
Linear Regression Curve
LSMA: Least Squares
SMA: Simple
SMMA/RMA: Smoothed/Running
SWMA: Symm. Weighted
TMA: Triangular
Triple EMA
VWMA: Volume Weighted
WMA: Weighted
ZLEMA: Zero Lag
VWAP: Vol Weighted Average
Welles Wilder MA

Multi Time Frame Moving Averages [Anan]Hello friends,
All your popular moving average now in one indicator, also no need to open a lot of tabs to see where is that moving average at that time frame,
with multi time frame feature, now u can see up to six multi time frame MA in the same chart with option to show/hide it
list of moving averages:
SMA
Smooth SMA
SuperSmooth MA
EMA
DEMA
TEMA
Triangular MA
QEMA
RMA
Hull MA
KAMA
WMA
VWMA
VWAP
CTI
LSMA
VIDYA
Blackman Filter
Adaptive RSI
also there is an option to see the Average of four lengths, i backtest this and found it super great !

MMI SignalTrend trading strategies filtered by the Market Meanness Index.
This is a port of the experiment described at
www.financial-hacker.com
www.financial-hacker.com
www.financial-hacker.com
www.financial-hacker.com
The Market Meanness Index tells whether the market is currently moving in or out of a "trending" regime. It can this way prevent losses by false signals of trend indicators. It is a purely statistical algorithm and not based on volatility, trends, or cycles of the price curve.
The indicator measures the meanness of the market - its tendency to revert to the mean after pretending to start a trend. If that happens too often, all trend following systems will bite the dust.
Inputs
Price Source: Either open, high, low, close, hl2, hlc3, or ohlc4. The default value is hlc3.
Trend MA Type: Either SMA, EMA, LowPass, Hull MA, Zero-Lag MA, ALMA, Laguerre, Smooth, Decycle. The default value is LowPass.
Trend MA Period: Sets the lookback period of trend MA. The default value is 200.
MMI Period: Sets the lookback period of the Market Meanness Index. The default value is 300.

Candlestick Trend Indicator v0.5 by JustUncleLRequested Update to this Indicator alert project. In this update I have added the option to be able select which Price Action candles you want included in the display and the generated alarm Alert. Other changes also included in this update:
Also added a Price Action candle for "Last Fractal S/R Break", this also a good continuation indication.
Added option to select a different moving average types for directional MA line.
Modified some default settings, using HullMA instead of Zero Lag EMA and standard MACD settings(12,26,9).
Description:
This is a trend following indicator and alert for Binary Options based on Candlestick patterns and trend line -
NOTE: original system was a forex trading system.
This code combines a number of indicators to create an overall trading strategy.
The indicator recognises and displays some useful candle named defined patterns that are used to support trend continuation:
Bearish + Bullish PinBars
Dark Cloud Cover
Piecing Line
Bullish + Bearish Harami
Bullish + Bearish Engulfing Candle
Bullish + Bearish Last Fractal S/R break
Also recognises main Price Action candles from ChrisMoody (CM), the four(4) price action patterns are colored coded bars:
Yellow = Inside Bar - breakout/continuance
Orange = Outside Bar - breakout/continuance
Aqua/Fuschia = Up/Down Shaved Bars - Buying/Selling pressure
Red/Green = Possible reversal PinBars - Reverse Down / reverse Up
The highlighted candles (maroon and darker green) represent the defined PA patterns that have been confirmed following the current trend direction that is indicated by the Hull MA(20) line (can select a different type of MA, or even disable) and confirmed by MACD direction (can be disabled). The confirmed Alerts are indication by green (buy) and red (sell) dots at the bottom of the chart. An alert is generated from this selection for the alert condition of the alarming system.
The fractal upper/lower break lines are also draw, if the (optional) last fractal break line is broken by a highlighted bar then this indicates a stronger trend conformation.
The MACD indicator MACD DEUTER 2 colour(12,26,9) you can visually see the MACD histogram colours with MACD direction - needs "MACD DEUTER 2 colour" indicator.
This multi-indicator set up is suitable for 1hr, 4hr and daily charts with 1-4 candle expiry.
References and Inspiration from:
Fractal Levels by RicardoSantos
Almost Zero Lag EMA
Candlestick Patterns With EMA by rmwaddelljr
CM_Price-Action-Bars by ChrisMoody
www.forexstrategiesresources.com
"Scalp Jockey - MTF MA Cross Visual Strategizer by JayRogers"

Correlated ATR MA | AdulariHow do I use it?
Never use this indicator as standalone trading signal, it should be used as confluence.
When the price is above the moving average this shows the bullish trend is strong.
When the price is below the moving average this shows the bearish trend is strong.
When the moving average is purple, the trend is bullish, when it is gray, the trend is bearish.
Features:
Purple line for bullish trend and gray line for bearish trend.
Custom formula combining an ATR and Hull MA to clearly indicate trend strength and direction.
Unique approach to moving averages by taking the average of 3 types of MA's combined with custom ATR's.
How does it work?
1 — ATR value is calculated, then the correlation between the source and ATR is calculated.
2 — Signal value is calculated from the difference between the previous source and ATR values.
3 — Final value is being calculated using the following formula:
cor * target + (1 - cor) * nz(atr , target)
4 — Moving average is calculated by getting the average of 3 values: a normal HMA, HMA plus final value, and HMA minus final value.

Trend System Multiple Moving Averages RatingThis is a trend system made with multiple moving averages designed especially for trending markets such as stocks or crypto.
It can be used with any timeframe.
Its made of multiple moving averages such as
Simple
Weighted
Volume Weighted
Exponential
Double EMA
Arnaud Legoux
Hull MA
Smoothed
Least Squares
Kaufman Adaptive
Triple EMA
Zero Lag
Fractal Adaptive
Variable Index Dynamic Average
Jurik Moving Average
Tillson
Triangular
Avg of all moving averages
It has also a rating, making an avg from all of the moving averages , going from -100 (all ma's are telling to go short ) to 100 ( all ma are telling to go long).
If you have any questions let me know !

Multi Timeframe Moving Average SelectorThis allows you to plot a moving average on a different timeframe to the one you are viewing.
For instance if you are on a 4hr chart, you can plot the position of the daily 200MA, 100EMA etc
On a 15min chart you could plot where the hourly MAs are.
You can define the length of the MA and the style, EMA, SMA Hull MA etc, the colour and the type.
As with all my scripts I have pinched bits of other peoples and spliced them together with my own bits and bobs. Credit where it's due but I don't even know where most of this came from, it's pretty bothed together.
Feedback appreciated
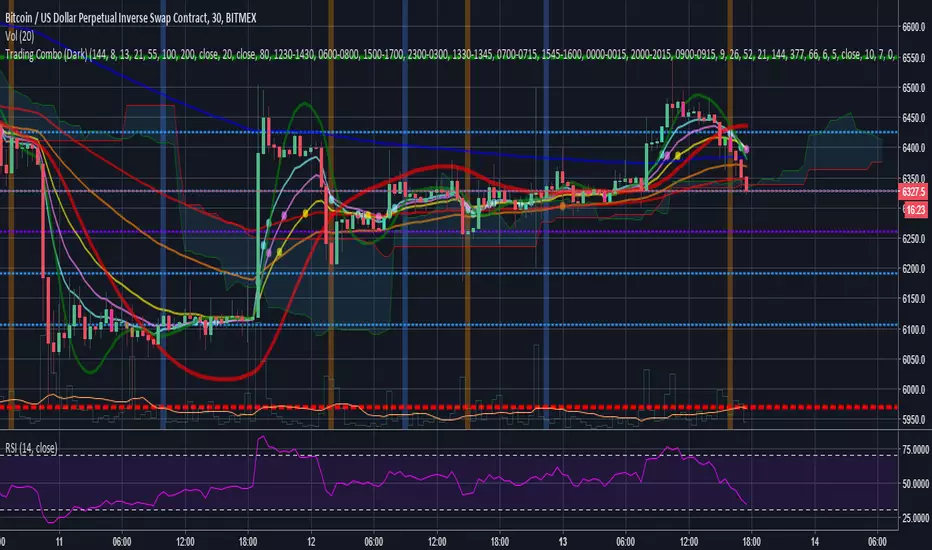
Trading Combo (Dark)This is a combo of many indicators including :
Ichimoku Cloud (With Buy and Sell Signals)
EMA
MA
HULL MA
Fibonacci Lines
Bitcoin 0.57% Kill Zones(Turned off by Default)
MA Turning Points
Reversal(Pin) Bars and Upshaved and Downshaved Bars(Inside and Outside Bars Disabled By default)
Credits to revanchdg for creating the script!
Credits for the source code go to:
Lazybear
ChrisMoody
100kiwi
Gesundheit
Updates:
- Removed all black colors so the script also works fine on the Dark theme
- Changed EMA9 to EMA8 and added EMA13
- Updated some labels for ease of configuration
Trading ComboThis is a combo of many indicators including :
Ichimoku Cloud(With Buy and Sell Signals)
EMA
MA
HULL MA
Fibonacci Lines
Bitcoin Kill Zones(Turned off by Default)
MA Turning Points
Reversal(Pin) Bars and Upshaved and Downshaved Bars(Inside and Outside Bars Disabled By default)
Credits to for the source code:
Lazybear
ChrisMoody
100kiwi
Gesundheit
vdub Atlasvdub Atlas, Multiple strategy combined indicator
ichmoku,
inside bollinger bands,
Multiple ma's,
Strength indicator MA's
Hull ma,
vdub binaryPro,
Session background colours.
Switch out any indicator you don't want.

TZtraderTZtrader
This is a TrendZones version with features to set stoploss and targets in short and long positions meant for use in intraday charts. It aims to provide signals for opening and closing long and short positions. In the comments under the TrendZones publication several people expressed a need for features for a short position similar to those for a long position as implemented in TrendZones, some want to use it for scalping, some asked for alerts. When I proposed to create a version for day trading with target lines based on ATR, several people liked the idea.
Full disclosure: I don’t do day trading, because, after I lost a lot of money, I had to promise my wife to stay away from it. I restrict myself to long term investing in stocks which are in uptrend. However I understand what a day trader needs. I gather from my experience that day trading or scalping is an attempt to earn something by opening a position in the morning and close, reopen and close it again during the day with a profit. It is usually done with leveraged instruments like CFD’s, futures, options, and what have you. Opening and closing positions is done within minutes, so the trader needs a quick and efficient way to set proper stoploss and target. TZtrader supports this by showing only three or four numbers on the price bar: The price of the instrument, The logical stop level (gray or green or maroon dots), and the target level (navy). All other numbers are suppressed to prevent mistakes. Also a clear feedback for current settings at the top-center of the pane and an alert feedback at bottom that flashes alerts during the development of the current bar and gives suppression status.
The script
First I made a bare bones version of TrendZones to which I added code for long and short trading setups and a bare setup for no position. The code for the logical stops in long setup had to be reviewed, after which this became the basis for stops in short setup.
Then I added code for 10 alert messages, which was a hassle, because this is the first time I coded alerts and the first time I used an array as a stack to avoid a complicated if-then construction. During testing the array caused a runtime error which I solved by adding ‘array.clear’ to the code, also I discovered that in TradingView separate alerts have to be created for all three setups - short, long and bare. Flipping setups is done in the inputs with a dropdown menu because Pine Script has no function for a clickable button.
One visual with three setups.
The visual has the TrendZones structure: Three near parallel very smooth curves, which border the moderate uptrend (green) and downtrend (orange) zone over and under the curve in the middle, the COG (Center Of Gravity). Where the price breaks out of these curves, strong trend zones show up over and under the curves, respectively strong uptrend (blue) and strong downtrend (red).
Three setups were made clearly different to avoid confusion and to provide oversight in case of multiple trades going on simultaneously which I imagine are monitored in one screen. You have to see which one is long, which short and which have no position. The long setup should not trigger short signals, nor should the short trigger long signals nor the bare setup exclusive long or short signals.
The Long setup is default, shown on the example chart. In this setup the Stoploss suggestions (green, gray and maroon dots) are under the price bars and the target line (navy) at a set distance above the High Border. A zone with a width of 1 ATR is drawn under the Low Border. In this setup 5 specific alerts are provided
The Short setup has the Stoploss suggestions over the price bars, the target line at a set distance under the Low Border. A zone with a width of 1 ATR is drawn above the High Border. This setup also has 5 specific alerts.
The Bare setup has no Stoploss suggestions, no target line and supports 4 alerts, 2 in common with the Long setup and 2 with Short.
The table below gives a summary of scripted alerts:
Setup = Where = When = Purpose
Long, Bare = Green Zone = Bars come from lower zones = Uptrend starts
Long, Bare = Green Zone = Sideways ends in uptrend = Uptrend resumes
Long = COG = First crossing = Uptrend might end warning
Long = Orange Zone = Bars come from higher zones = Uptrend ended take care
Long = Red Zone = Bars come from higher zones = Strong downtrend->close Long
Short, Bare = Orange Zone = Bars come from higher zones = Downtrend starts
Short, Bare = Orange Zone = Sideways ends in downtrend = Downtrend resumes
Short = COG = First crossing = Downtrend might end warning
Short = Green Zone = Bars come from lower zones = Downtrend ended take care
Short = Blue Zone = Bars come from lower zones = Strong uptrend -> close short
You can use script alerts in TradingView by clicking the clock in the sidebar, then ‘create alert’ or plus, as condition you choose ‘Tztrader’ in the dialog box, then the “Any alert() function call” option (the first item in the list). The script lets the valid alert trigger by TradingView after the bar is completed, this can differ from the flashed messages during its formation.
When you create alerts in Tradingview, I advice to do that for each setup, then to make only the alert active which matches the current setup, pause the other ones.
Suppressing false and annoying signals
The script has two ways to suppress such signals, which have to do with the numbers in the alert feedback. The numbers left and right of the message with a colored background, depict the zones in which the previous (left) and current (right) bar move. 1 is the strong downtrend zone (red), 2 the moderate downtrend zone (orange), 3 the sideways zones (gray), 4 the COG (gray), 5 the moderate uptrend zone (green), 6 the strong uptrend zone (blue), 7 something went wrong with assigning a zone (black). In extensive testing the number 7 never occurs, because I catch that error in the code. The idea is that an alert is only triggered if the previous bar was in a different zone. When the bars are in the same zone, no alert is possible. This way all annoying signals are suppressed and long, short and bare get the appropriate alerts.
The third number is a counter. It counts how often the COG is crossed without touching the outer curves. The counter will reset to zero when the upper or lower curve is touched. When the count is 1 you have zone situation 4 and appropriate alerts are flashed. When the count is 2 or higher, a sideways situation (3) is called and while the recrossings are going on, no alerts can be flashed. This suppresses false signals. The ATR zone and curves are brownish-gray where sideways happens(ed). When the channel is narrowed down to just the three curves, some false signals still might occur.
Inputs
“Setup”, default is long, drop down menu provides long, short and bare.
“Target ATR”, default is 2, sets the amount of ATR for the target line. In 1 minute charts 4 seems an appropriate setting, you have to learn by experience which setting works.
“show feedback …” default is on, This creates two feedback labels, a Setup feedback on top of the pane, which shows charted instrument, Setup type, Trend and timeframe of the chart. Background color of Trend feedback is green when it matches the setup, red when mismatches and gray when no match. The alert feedback at the bottom of the pane shows a number, a message and two numbers. The numbers will be explained in the chapter about false and annoying signals below. During formation of the bar, valid alerts are flashed with a blue background, otherwise the message ‘alerts for current bar suppressed’.
Logical Stops
The curves are the logical place to put stops, because, as these are averages of the high and low border of a Donchian channel, they signify the ‘natural’ current highest, lowest and main level in the lookback period that fit the monitored trend setup. A downtrend turns into an uptrend when a breakout of the upper curve occurs. If you are short, that is where you want to close position, so the logical place for the stoploss is the upper curve. Vice versa, when you are long, the logical stop is on the lower curve. The stops show up as green or gray dots on the curves, the green dots signify a nice entry level, the gray stops are there to suggest levels where unrealized profits might be secured, the maroon dots indicate that the trend mismatches the setup.
COG versus other lines
Any line used to identify a trend, be it some MA or some other line, is interpreted the same way: When the bars move above the line there is an uptrend and when below, a downtrend. COG is not different in that sense. If you put such a line in the same chart as TZtrader, you can see situations in which the other line shows uptrend or downtrend earlier than COG, also some other lines, e.g. Hull MA, are very good at showing tops and bottoms, while COG ignores these. On the other hand the other lines are usually a little nervous and let you shake out of position too soon. Just like the other lines, COG gives false signals when it is near horizontal. The advantage of the placement COG is the tolerance for pull backs. This way TZtrader keeps you longer in the trend. Such pull backs are often ‘flags’ which are interpreted in TA as confirming the trend. Tztrader aims to get you in position reasonably soon when a trend begins and out of position as soon as the trend turns against you. The placement of COG is done with a fundamentally different algorithm than other lines as it is not an average of prices, but the middle of two averages of borders of a Donchian channel. This gives the two zones between the curves the same quality as the two zones above and below the middle line of a standard Donchian Channel.
A multi timeframe application.
In this scenario you put a 5 minutes and 1 minute chart with Tztrader side by side. If the 5 minutes shows uptrend, set the 1 minute on long trading and open positions when the trend matches uptrend en close when it mismatches. Don’t open short positions. Once the 5 minute changes to downtrend, set Tztrader in the 1 minute to short trading and open positions when the trend matches downtrend and close when it mismatches.
The idea is that in a long ‘context’, provided by the 5 minutes, the uptrends in the 1 minute will last longer and go further, vice versa for the short ‘context’. This way you do swing trading in the 5 minute in a smart way, maximizing profits.
You can do this with any timeframe pairs with a proportion of around 5:1, 4:1, 6:1, like e.g. 60 minutes and 15 minutes or weeks and days (5 trading days in a week).
Dear day-traders, may this tool be helpful and may your days be blessed.
Take care

Correlated ATR Bands | AdulariHow do I use it?
Never use this indicator as standalone trading signal, it should be used as confluence.
It is highly recommended to use this indicator on the 15m timeframe and above, try experimenting with the inverse feature and multipliers as well.
When the price is above the moving average this shows the bullish trend is strong.
When the price is below the moving average this shows the bearish trend is strong.
When the moving average is purple, the trend is bullish , when it is gray, the trend is bearish.
When price is above the upper band this may indicate a bearish reversal.
When price is below the lower band this may indicate a bullish reversal.
Features:
Purple line for bullish trend and gray line for bearish trend.
Custom formula combining an ATR and Hull MA to clearly indicate trend strength and direction.
Unique approach to moving averages and bands by taking the average of 2 types of MA's combined with custom ATR's, then multiplying these by correlation factors.
Bands to indicate possible trend reversals when price crosses them.
How does it work?
1 — ATR value is calculated, then the correlation between the source and ATR is calculated.
2 — Final value is calculated using the following formula:
correlation * atr + (1 - correlation) * nz(atr , atr)
3 — Moving average is calculated with the following formula:
ta.hma((1-(correlation/100*(1+weight/10)))*(ta.sma(source+value, smoothing)+ta.sma(source-value,smoothing))/2,flength)
4 — Bands calculation using multipliers.

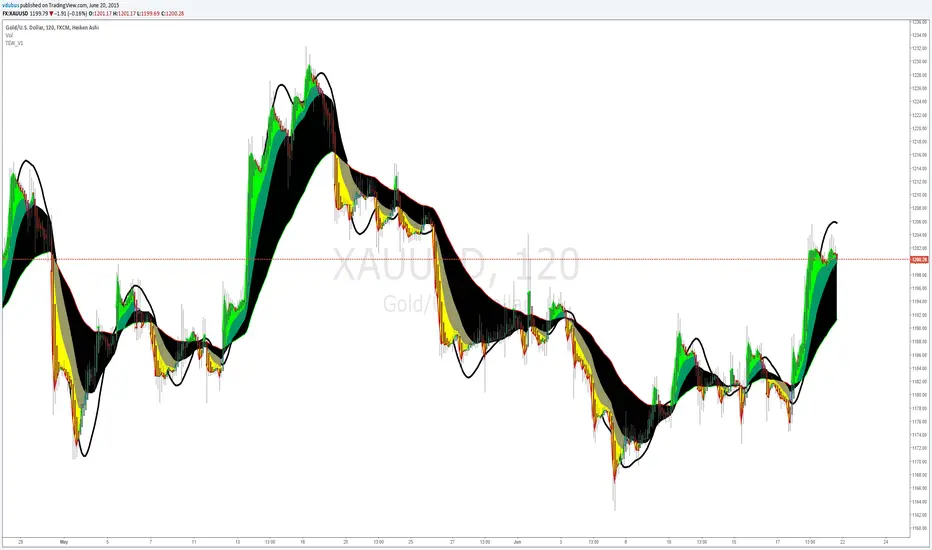
Thermal Expansion Wave VDUB_v1TEW_V1
*** Modified, Madrid Ma Ribbon, Mashup. Using three colours indicating thermal expansion zones using Hull ma for the pivot points.
Dammu AI ADVANCED PRO1. Indicator Overview
Name: Dammu
Type: Overlay indicator (draws on price chart)
Purpose: Combines SuperTrend, SMA/EMA trends, Swing/Structure analysis, Order Blocks, Fair Value Gaps, High/Low levels, TP/SL labels, and alerts.
Pine Script Version: v5
2. SuperTrend Module
Computes SuperTrend line using ATR and sensitivity.
Signals:
Bullish: Price crosses above SuperTrend.
Bearish: Price crosses below SuperTrend.
Plots buy/sell labels 🚀🐻 based on SMA comparison and SuperTrend cross.
3. SMA/EMA Trend Components
SMA8 & SMA9: Used for additional trend confirmation.
EMA lines: Multiple EMAs with different multipliers for trend detection.
Trend Cloud: Uses Hull MA for trend smoothing.
4. Risk Management
TP/SL Levels: Automatic calculation of stop-loss and take-profit (TP1, TP2, TP3).
Configurable ATR-based risk percentage.
Lines and labels drawn for visual TP/SL.
5. Chart Features
Smooth Range Filter: Filters noise for trend detection.
Colored Trend Cloud: Upward trend = cyan, downward = red.
Sideways Market: ADX filter to color bars purple if trend is weak/sideways.
Bar Colors: Green/red based on SuperTrend signals.
6. Swing & Structure Analysis
Detects Swing Highs/Lows, labels as HH, LH, LL, HL.
Detects CHoCH (Change of Character) or BOS (Break of Structure).
Can show internal or swing structures with configurable label size and color.
7. Order Blocks (Smart Money Concepts)
Detects Internal Order Blocks (iOB) and Swing Order Blocks (OB).
Stores top/bottom/left/time/type in arrays.
Colors and shows boxes based on bullish/bearish type.
Automatically deletes OB if price breaks the block.
8. Fair Value Gaps (FVG)
Identifies gaps between candles as potential trading zones.
Configurable bullish/bearish colors and extension bars.
9. EQH/EQL (Equal Highs/Lows)
Detects equal highs/lows using a threshold.
Plots dotted lines and labels EQH/EQL.
10. High/Low Levels MTF
Optional plotting of previous daily, weekly, monthly highs/lows.
11. Premium/Discount Zones
Plots Premium, Discount, and Equilibrium Zones.
Colors: Premium = red, Discount = green, Equilibrium = gray.
12. Alerts
Buy/Sell alerts for:
SuperTrend crossover
BOS/CHoCH (swing/internal)
EQH/EQL triggers
13. Miscellaneous
Configurable visuals: line style, label size, transparency.
Adjustable volatility filters, ATR lengths, smoothing constants.
Integrated risk & reward visualization.
✅ In short:
This is an all-in-one Smart Money + Trend indicator with SuperTrend signals, swing/structure detection, order blocks, FVGs, EQH/EQL, TP/SL visualization, and optional alerts. It’s designed for both trend-following and order-block-based trading.
If you want, I can make a super-short 1-paragraph version that summarizes it even faster for quick reference.

RSI-BBGun-v6.1RSI BB Gun – Operator's Guide
“Eyes on target. Wait for the right moment. Then strike.”
________________________________________
🎯 Mission Objective
RSI BB Gun identifies extreme market conditions using RSI and Bollinger Bands, then overlays trend and volatility intelligence so you know when the setup is real.
The ❌ is your target acquisition signal—price just moved from an extreme zone back into play. Now you’ve got a clean radar lock.
________________________________________
📡 How to Operate
🟣 Step 1: Watch for the ❌'s (Black X = RSI & Bollinger Band Extremes Encountered)
• The Purple X means price and RSI are both stretched—and just snapped back into range.
• The target is now in the cross hairs and potentially ready for engagement.
🟥 Step 2: Confirm the Trend
• The thick ribbon tells you if the trend is with you:
o 🟢 Green = Uptrend. Focus on long setups.
o 🔴 Red = Downtrend. Focus on puts or short plays.
• Align with trend. Only engage when the field favors your position.
🔺 Step 3: Evaluate Signal Context
• Green Triangles = price just crossed below lower Bollinger Band (oversold).
• Red Triangles = price crossed above upper Band (overbought).
• Horizontal Lines Disappeared = The bar after the green or red horizontal line disappears means its time. We patiently wait for this as it means the momentum may be changing.
• These are your early indicators—they scout the setup on the GO / NO GO DECISION.
• ❌ + triangle + trend = clean shot.
________________________________________
☁️ Avoid These Situations
• ❌ in a choppy/no-trend zone = false alarm. Don’t engage.
• Repeated black ❌s without a purple ❌confirmation = low conviction. Let it go.
________________________________________
________________________________________
🪖 Operator's Mindset
“You don’t chase trades. You stalk them. When the ❌ flashes, the system has found a target. What you do next is up to your discipline, your tools, and your plan.”
________________________________________
Note: This is a free version. Upcoming paid version includes multi-timeframes working together. Multiple strategies. Volatility meter. Make money and master the BB Gun so that you can elevate to the Snipers weapon.
🔒 Want More Firepower?
Upgraded version coming soon. Unlocks next-gen targeting tools:
• Multi-timeframe RSI intelligence in a live dashboard
• Precision-timed combo signals based on layered volatility + RSI logic
• Advanced trend filters, trade zone overlays, and sniper-level entry indicators
• Ideal for swing traders and options strategists who want clarity under pressure
💥 Budget-friendly. No subscription. Upgrade when you're ready to go Pro.
Tip: Make 4+ trades mastering this setup. Then use a small portion of the trades to gain more features. Always be in a position you cannot lose.
🆚 Why This Beats Standard RSI/BB Tools
Mission Feature Basic Indicators RSI Ribbon Lite
Trend Confirmation ❌ ✅ Ribbon Overlay
Multi-Timeframe Awareness ❌ ✅ 5-Timeframe RSI Grid
Volatility Confirmation ❌ ✅ Weighted ATR Scoring
Combo Signal Alerts ❌ ✅ ❌ Reentry Combo Alerts
TradingView Alerts ❌ ✅ Built-In Radar Ping
#rsi #bb #bollingerbands #hull ma #trend

StatMetricsLibrary "StatMetrics"
A utility library for common statistical indicators and ratios used in technical analysis.
Includes Z-Score, correlation, PLF, SRI, Sharpe, Sortino, Omega ratios, and normalization tools.
zscore(src, len)
Calculates the Z-score of a series
Parameters:
src (float) : The input price or series (e.g., close)
len (simple int) : The lookback period for mean and standard deviation
Returns: Z-score: number of standard deviations the input is from the mean
corr(x, y, len)
Computes Pearson correlation coefficient between two series
Parameters:
x (float) : First series
y (float) : Second series
len (simple int) : Lookback period
Returns: Correlation coefficient between -1 and 1
plf(src, longLen, shortLen, smoothLen)
Calculates the Price Lag Factor (PLF) as the difference between long and short Z-scores, normalized and smoothed
Parameters:
src (float) : Source series (e.g., close)
longLen (simple int) : Long Z-score period
shortLen (simple int) : Short Z-score period
smoothLen (simple int) : Hull MA smoothing length
Returns: Smoothed and normalized PLF oscillator
sri(signal, len)
Computes the Statistical Reliability Index (SRI) based on trend persistence
Parameters:
signal (float) : A price or signal series (e.g., smoothed PLF)
len (simple int) : Lookback period for smoothing and deviation
Returns: Normalized trend reliability score
sharpe(src, len)
Calculates the Sharpe Ratio over a period
Parameters:
src (float) : Price series (e.g., close)
len (simple int) : Lookback period
Returns: Sharpe ratio value
sortino(src, len)
Calculates the Sortino Ratio over a period, using only downside volatility
Parameters:
src (float) : Price series
len (simple int) : Lookback period
Returns: Sortino ratio value
omega(src, len)
Calculates the Omega Ratio as the ratio of upside to downside return area
Parameters:
src (float) : Price series
len (simple int) : Lookback period
Returns: Omega ratio value
beta(asset, benchmark, len)
Calculates beta coefficient of asset vs benchmark using rolling covariance
Parameters:
asset (float) : Series of the asset (e.g., close)
benchmark (float) : Series of the benchmark (e.g., SPX close)
len (simple int) : Lookback window
Returns: Beta value (slope of linear regression)
alpha(asset, benchmark, len)
Calculates rolling alpha of an asset relative to a benchmark
Parameters:
asset (float) : Series of the asset (e.g., close)
benchmark (float) : Series of the benchmark (e.g., SPX close)
len (simple int) : Lookback window
Returns: Alpha value (excess return not explained by Beta exposure)
skew(x, len)
Computes skewness of a return series
Parameters:
x (float) : Input series (e.g., returns)
len (simple int) : Lookback period
Returns: Skewness value
kurtosis(x, len)
Computes kurtosis of a return series
Parameters:
x (float) : Input series (e.g., returns)
len (simple int) : Lookback period
Returns: Kurtosis value
cv(x, len)
Calculates Coefficient of Variation
Parameters:
x (float) : Input series (e.g., returns or prices)
len (simple int) : Lookback period
Returns: CV value
autocorr(x, len)
Calculates autocorrelation with 1-lag
Parameters:
x (float) : Series to test
len (simple int) : Lookback window
Returns: Autocorrelation at lag 1
stderr(x, len)
Calculates rolling standard error of a series
Parameters:
x (float) : Input series
len (simple int) : Lookback window
Returns: Standard error (std dev / sqrt(n))
info_ratio(asset, benchmark, len)
Calculates the Information Ratio
Parameters:
asset (float) : Asset price series
benchmark (float) : Benchmark price series
len (simple int) : Lookback period
Returns: Information ratio (alpha / tracking error)
tracking_error(asset, benchmark, len)
Measures deviation from benchmark (Tracking Error)
Parameters:
asset (float) : Asset return series
benchmark (float) : Benchmark return series
len (simple int) : Lookback window
Returns: Tracking error value
max_drawdown(x, len)
Computes maximum drawdown over a rolling window
Parameters:
x (float) : Price series
len (simple int) : Lookback window
Returns: Rolling max drawdown percentage (as a negative value)
zscore_signal(z, ob, os)
Converts Z-score into a 3-level signal
Parameters:
z (float) : Z-score series
ob (float) : Overbought threshold
os (float) : Oversold threshold
Returns: -1, 0, or 1 depending on signal state
r_squared(x, y, len)
Calculates rolling R-squared (coefficient of determination)
Parameters:
x (float) : Asset returns
y (float) : Benchmark returns
len (simple int) : Lookback window
Returns: R-squared value (0 to 1)
entropy(x, len)
Approximates Shannon entropy using log returns
Parameters:
x (float) : Price series
len (simple int) : Lookback period
Returns: Approximate entropy
zreversal(z)
Detects Z-score reversals to the mean
Parameters:
z (float) : Z-score series
Returns: +1 on upward reversal, -1 on downward
momentum_rank(x, len)
Calculates relative momentum strength
Parameters:
x (float) : Price series
len (simple int) : Lookback window
Returns: Proportion of lookback where current price is higher
normalize(x, len)
Normalizes a series to a 0–1 range over a period
Parameters:
x (float) : The input series
len (simple int) : Lookback period
Returns: Normalized value between 0 and 1
composite_score(score1, score2, score3)
Combines multiple normalized scores into a composite score
Parameters:
score1 (float)
score2 (float)
score3 (float)
Returns: Average composite score

Apex Edge SMC Tactical Suite
🛰 Apex Edge SMC Tactical Suite
Apex Edge SMC Tactical Suite is a precision-engineered multi-signal tool designed for advanced traders who demand real-time edge detection, breakout identification, and smart volatility-based risk placement. Built to blend seamlessly into any price action, SMC, or momentum-based strategy.
🔧 Core Features:
📍 Entry Signals
Green & red arrows appear only when a candle meets strict "Power Candle" criteria:
High momentum breakout
Volume spike confirmation
OBV spike divergence
Trend & HTF filter optional
Volatility-adjusted stop placement
💥 Power Candles
Smart detection of explosive volume+range candles
Custom "fuel score" system ranks their momentum potential
Displays as either candle highlights or subtle labels
📊 Fuel Meter
RSI-based energy tracker with customizable threshold
Plots real-time bar strength on a mini histogram
🧠 Trap Detection + Reversals
Detects stop hunt wicks or "liquidity traps"
Shows reversal diamonds on potential reclaim setups
Built-in swing logic confirms trap reversals
🧮 HTF Filtering
Optional higher-timeframe trend filter via Hull MA
Keeps signals aligned with broader market direction
📦 TP/SL Zones
Risk is calculated using volatility clustering (recent swing zones)
TP auto-calculated using ATR-based expansion
🔔 Alerts Included:
✅ Power Candle Detection
✅ Long/Short Entry Alerts
✅ Exit Signal Alerts
✅ Trap Defense Alerts
✅ Trap Reversal Confirmations
🎯 Ideal For:
SMC / ICT traders
Breakout traders
Trend followers
Scalpers / intraday setups
Momentum + volume combo traders
⚠️ Tip: Best paired with clean chart layouts, market structure, or order block frameworks. Can be combined with internal/external liquidity sweep logic for extra confluence.
Feel free to play around with the code and if you're a professional coder (unlike me) then please tag me into any versions that you can make better. Enjoy!
Disclaimer - This script was created entirely with many hours using the assistance of ChatGPT

Market StructureThis is an advanced, non-repainting Market Structure indicator that provides a robust framework for understanding market dynamics across any timeframe and instrument.
Key Features:
- Non-repainting market structure detection using swing highs/lows
- Clear identification of internal and general market structure levels
- Breakout threshold system for structure adjustments
- Integrated multi-timeframe compatibility
- Rich selection of 30+ moving average types, from basic to advanced adaptive variants
What Makes It Different:
Unlike most market structure indicators that repaint or modify past signals, this implementation uses a fixed-length lookback period to identify genuine swing points.
This means once a structure level or pivot is identified, it stays permanent - providing reliable signals for analysis and trading decisions.
The indicator combines two layers of market structure:
1. Internal Structure (lighter lines) - More sensitive to local price action
2. General Structure (darker lines) - Shows broader market context
Technical Details:
- Uses advanced pivot detection algorithm with customizable swing size
- Implements consecutive break counting for structure adjustments
- Supports both close and high/low price levels for breakout detection
- Includes offset option for better visual alignment
- Each structure break is validated against multiple conditions to prevent false signals
Offset on:
Offset off:
Moving Averages Library:
Includes comprehensive selection of moving averages, from traditional to advanced adaptive types:
- Basic: SMA, EMA, WMA, VWMA
- Advanced: KAMA, ALMA, VIDYA, FRAMA
- Specialized: Hull MA, Ehlers Filter Series
- Adaptive: JMA, RPMA, and many more
Perfect for:
- Price action analysis
- Trend direction confirmation
- Support/resistance identification
- Market structure trading strategies
- Multiple timeframe analysis
This open-source tool is designed to help traders better understand market dynamics and make more informed trading decisions. Feel free to use, modify, and enhance it for your trading needs.
