Wskaźniki, strategie i biblioteki
Calculate a sort of correlation between two symbols based only on the sign of their changes, regardless of the amplitude of price change. When positive, the two symbols tend to move together. When negative, the symbols move in opposite directions. Since there is no significance calculation, and that the result is binary, keep in mind that correlation will always...
Visually see how well a symbol tracks another's movements, without taking price deltas into account. For example, a 1% move on the index and a 5% move on the target will return a DCC value of 1. An index move of 0.5% on the index and a 10% move on the target will also return a DCC value of 1. The same happens for downward moves. The SMA value can be set to...
For those that want technical ratings but don't want waste valuable screen real estate. Candles are colored to the rating strength. It also plots the results for "total", "MA" and "other" in a table on right of screen. Table and candle coloring can be turned off in style settings. This script uses the built in Technical Ratings indicator. For more informations on...
0.65 -0.666 Fib levels or commonly know as the CC pocket Marks Strong Support/Ressitance, Use with conflunce. Lookback Length is adjustable Let me know any suggestions or ideas which could help improve
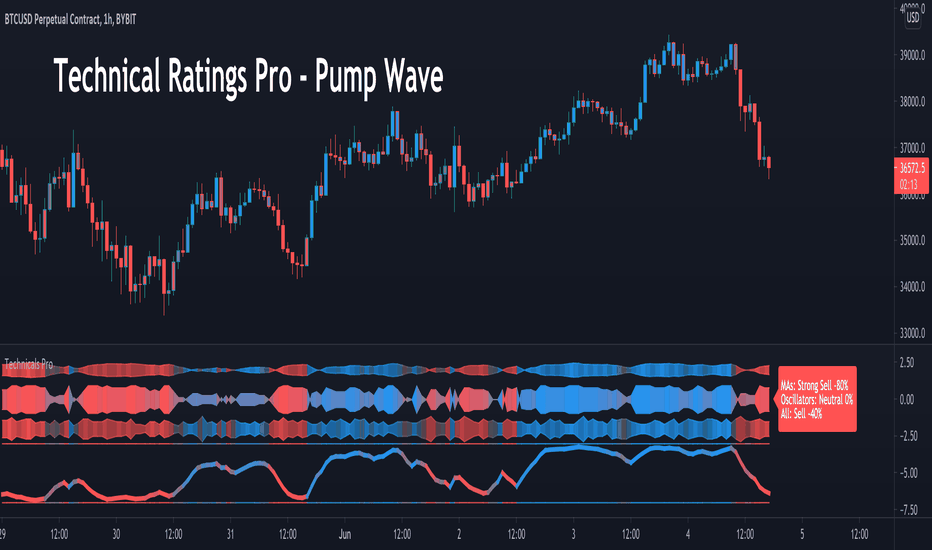
This script uses the built in Technical Ratings indicator but interprets the data visually. It plots the results for "total", "MA" and "other" as pump waves. It uses MA to plot a trend line (can be turned off in settings) . Candles are colored to the rating strength and a percentage number was added to the results. For more informations on the Technical Ratings...


