Rozpocznij
Społeczność Skrypty

buying

Wskaźniki, strategie i biblioteki

Wszystkie typy
Wszystkie typy
Wskaźniki
Strategie
Biblioteki
Tylko Open Source
Buying and Selling Pressure Raw Multi (TG Fork)
BTCUSD: Buying and Selling Pressure Raw Multi (TG Fork)
tartigradia tartigradia P Zaktualizowano 

Visualize raw buying and selling pressure via 3 different calculation methods, all superimposed with dynamic rescaling. Buying and selling pressure is the concept of quantifying the disproportion between buying and selling. In practice, there is no single definitive way to calculate it. This indicator is a merge to display three different methods to calculate...

57
0
Pressure - Buying and Selling
BTCUSD: Pressure - Buying and Selling
monophobiafafe monophobiafafe

This is the Pressure Indicator. The Pressure Indicator analyzes a number of price ratios to measure the pressure of Buyers and Sellers. I’ve also added to the indicator: 1) Moving Averages (MA) – You can choose 3 types of MA: - Simple Moving Average (SMA) - Exponential Moving Average (EMA) - default - Volume Weighted Moving Average (VWMA) - Arnaud Legoux Moving...

44
0
Buying & Selling Pressure
SPX: Buying & Selling Pressure
fract fract P Zaktualizowano 

Buying and selling pressure is a volatility indicator which denotes the balance between buyers and sellers inside candlestick. You set the length to average it just like ATR. But This offers further break down of participants of the market. Pretty much at any condition of the market the indicator can filter out interesting details to make trading decisions...

376
19
Pro Trading Art - Insider Entry with alert
BTCUSDT: Pro Trading Art - Insider Entry with alert
protradingart protradingart P

This indicator is based on volume and ma. This will help you to detect higher volume on chart. You can create alert to stay updated. I am using Fibonacci golden ratio to multiply the current volume. My logic is if volume comes greater than factor of Fibonacci number and current volume then consider it as a insider entry.

69
0
Timeframe Time of Day Buying and Selling Strategy
BTCUSD: Timeframe Time of Day Buying and Selling Strategy
tormunddookie tormunddookie

This strategy allows you to back test longing or shorting or do nothing during time increments of 30 minutes. The price trends in one direction every 30 minutes and this strategy allows you to test various 30 minute time frames across a range of dates to capitalize on this. Make sure you are in the 30 minute time frame while viewing the performance and trade history.

137
0
Rolling Cumulative Volume
PPTBTC: Rolling Cumulative Volume
i_hodl i_hodl Zaktualizowano 

This indicator show a simple rolling cumulative volume. A field is specified. Then all last volume indicators are summed. For example it could calculate last 24h Volume if you use the 1h bars and set the length for 24.

109
3
Day's Buy Sell Volume label
MARUTI: Day's Buy Sell Volume label
TJalam TJalam P Zaktualizowano 

This indicator looks simple but it was bit tricky to code and to make it work on all time frames . I have used array in this to showcase the use of array, array give you more flexibly. It works on all time frame 1m 2m 3m 5m 10m 15m 30m 60m 120m. When the time frame is greater than the or equal to "D" it will show the current bar volume only. Total volume is...

772
72
Buying Selling Volume
AMZN: Buying Selling Volume
ceyhun ceyhun Zaktualizowano 

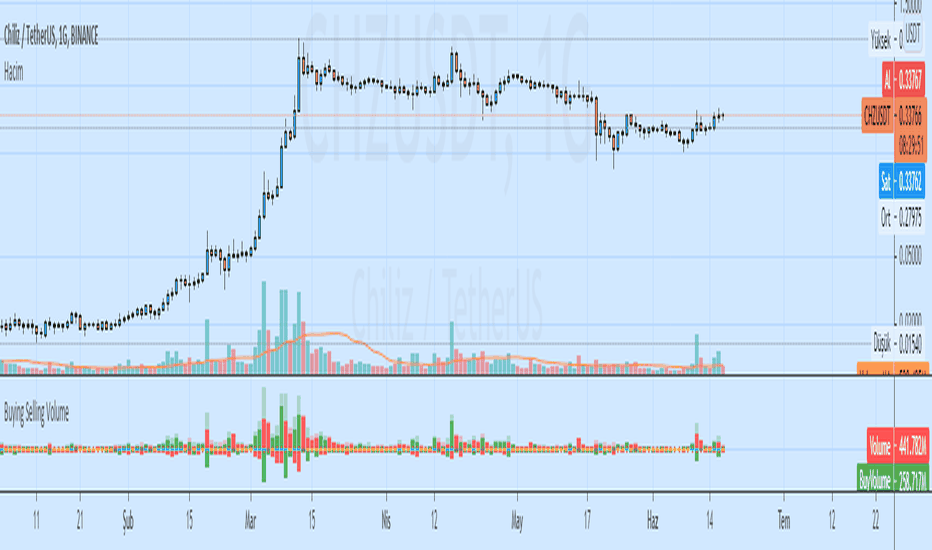
Buying Selling Volume -Buy Volume -Sell Volume -Buy Volume Percent % -Sell Volume Percent % -Volume Index -Buy Sell Volume- BuyVolume>SellVolume=Blue barcolor SellVolume>BuyVolume=Purple barcolor -Volume Index- VolumeIndex>length and close > open =Cyan barcolor VolumeIndex>length and close < open =Gray barcolor VolumeIndex<=length = Yellow barcolor

3842
61
Buying and Selling Smoothed with Histogram
USDCAD: Buying and Selling Smoothed with Histogram
ceyhun ceyhun Zaktualizowano 

Buying and Selling Smoothed with Histogram Smoothed version with version with a red line representing the selling pressure and a green line which represents the Buying pressure. If the green line is above the red line it would mean that the Buying pressure is more and vice versa. The difference between the two is plotted as a Histogram. This is a cumulative...

340
8
Buying and Selling Pressure Raw
USDCAD: Buying and Selling Pressure Raw
ceyhun ceyhun

Buying and Selling Pressure Raw Raw Buying and selling pressure Indicator. The Raw buying and selling indication is provided in terms of a Columns. Green bars above zero show the buying pressure and the red bars below the zero line show the selling pressure. This presents a good visual representation of the dominating pressure.

553
8
Demand Index
BTCUSD: Demand Index
doughboy doughboy Zaktualizowano 

demand index

1979
24
Miłość w każdym #TradingView
50M+

Traderów i inwestorów, którzy odwiedzają nas co miesiąc

#1

Najlepsza witryna na świecie, jeśli chodzi o wszystkie kwestie związane z inwestowaniem

4.9

Z ponad miliona recenzji. Żadna inna aplikacja finanse nie jest tak popularna

10M+

Niestandardowe skrypty i pomysły udostępnione przez naszych użytkowników

Wykres TradingView na Instagramie @l.m._investment

@l.m._investment

Wykres TradingView na Instagramie @maurice.method

@maurice.method

Wykres TradingView na Instagramie @ftmocomx

@ftmocomx

Wykres TradingView na Instagramie @chartfeed

@chartfeed

Wykres TradingView na Instagramie @jasmineeevn

@jasmineeevn

Wykres TradingView na Instagramie @laptopmoneygang

@laptopmoneygang

Wykres TradingView na Instagramie @setupstrading

@setupstrading

Wykres TradingView na Instagramie @investroy

@investroy

Wykres TradingView na Instagramie @chartfeed

@chartfeed

Wykres TradingView na Instagramie @jrod4x

@jrod4x

Wykres TradingView na Instagramie @lala_saymyname

@lala_saymyname

Wykres TradingView na Instagramie @bhtrading

@bhtrading

Wykres TradingView na Instagramie @gibsong_mor

@gibsong_mor

Wykres TradingView na Instagramie @javier.vasquezpalacios

@javier.vasquezpalacios

Wykres TradingView na Instagramie @tradinglifestylestore

@tradinglifestylestore

Wykres TradingView na Instagramie @TradingView

@TradingView

Wykres TradingView na Instagramie @mytradingsetup

@mytradingsetup

Wykres TradingView na Instagramie @zuko_carmona

@zuko_carmona

Alex Honnold na skale

Whatever the trade

DlategoDlatego
Produkty
  • Wykres
  • Skrypt Pine
  • Skaner akcji
  • Skaner Forex
  • Skaner Par Kryptowalutowych
  • Skaner Monet Krypto
  • Mapa cieplna Akcji
  • Crypto Heatmap
  • Kalendarz ekonomiczny
  • Kalendarz wyników
  • Iskry
  • Przepływ wiadomości
  • TradingView Desktop
  • Aplikacja mobilna
  • Kontrakty terminowe CME Group
Spółka
  • O nas
  • Funkcje
  • Cennik
  • Ściana Miłości
  • Sportowcy
  • Manifest
  • Kariera
  • Blog
  • Luka w zabezpieczeniach
  • Strona Status
  • Warunki Użytkowania
  • Wyłączenie odpowiedzialności
  • Polityka prywatności
  • Polityka Plików Cookie
Społeczność
  • Poleć przyjaciela
  • Pomysły
  • Skrypty
  • Streamy
  • Dobre Praktyki
  • Moderatorzy
  • Czarodzieje Pine Script™
  • Czat
Dla Biznesu
  • Widżety
  • Reklama
  • Rozwiązania internetowe i brokerskie
  • Wykresy
  • Biblioteka Lightweight Charts™
  • Integracja usług brokerskich
  • Program Partnerski
Pobierz z App Store Pobierz z App Store Pobierz z Google Play Pobierz z Google Play
Pobierz aplikację Desktop Pobierz aplikację Desktop Handluj na TradingView Handluj na TradingView
Wybierz dane giełdowe dostarczane przez ICE Data Services © 2023 TradingView, Inc.