plot annotation
The annotation plot accepts one mandatory argument — the value of a series type — and displays it on the chart as a line. A very basic call looks like this:
plot(close)
However, because there are automatic type conversions in Pine, instead of a series type value, any numerical value can be transmitted. For example:
plot(125.2)
In this case, the value 125.2 will be automatically converted to a series type value which will be the same number on every bar. The plot will be represented as a horizontal line.
The annotation plot has a multitude of optional arguments, in
particular those which set the graph’s display style: style,
color, title, linewidth, transparency, and others.
The parameter color can have a different effect depending on the
transmitted value. If it is set equal to a color type’s constant, for
example red, then the whole chart will be plotted with a red color:
plot(close, color=red)
However, the argument color can receive an expression of a series
type of colored values as values. This series of colors will be used to
color the chart when rendered. For example:
c = close >= open ? lime : red
plot(close, color = c)
Interest also represents the argument offset of the function
plot. It specifies the shift used when the chart is plotted
(negative values shift the chart to the left, while positive values — to
the right) [1]. For example:
study("My Script 12", overlay=true)
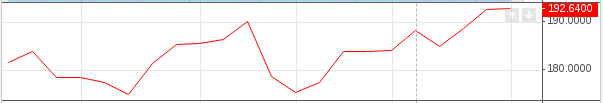
plot(close, color=red, offset=-5)
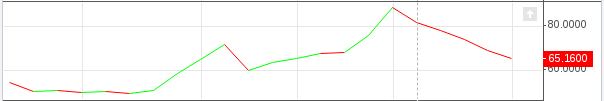
plot(close, color=lime, offset=5)
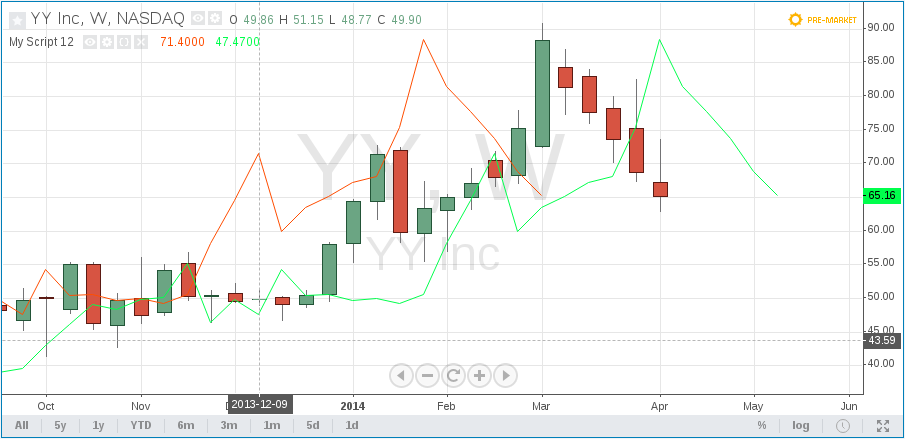
As can be seen in the screenshot, the red series has been shifted to the
left (since the argument’s value offset is negative), while the green
series has been shifted to the right (its value offset is positive).
Footnotes
| [1] | In Pine there is a built-in function
offset
which also enables the values of a series to be shifted, but only to the
right. At the same time the values ‘out of range’ of the current bar are
discarded. The advantage of offset lies in the fact that its result
can be used in other expressions to execute complex calculations. In the
case of the argument offset of the function plot, the shift appears
to be merely a visual effect of the plot. |