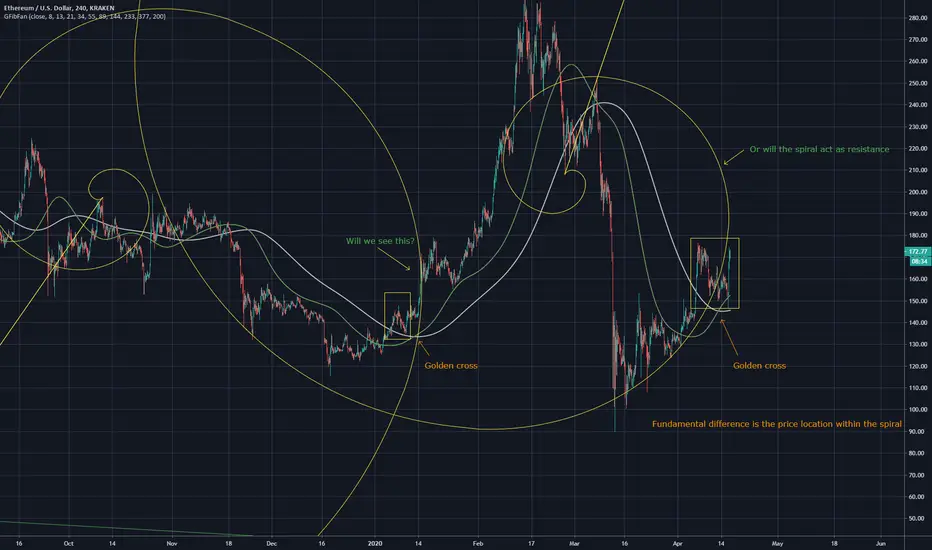
Comparison of two similar points on Ethereum
The previous golden cross produced a run that was on the INSIDE of the fibonacci spiral
While this golden cross is on the outside of the fib spiral, will this repeat? Or will it act as a resistance

Here is my bottoms chart for Ethereum showing bottom points and potential future bottoms
The previous golden cross produced a run that was on the INSIDE of the fibonacci spiral
While this golden cross is on the outside of the fib spiral, will this repeat? Or will it act as a resistance
Here is my bottoms chart for Ethereum showing bottom points and potential future bottoms
Wyłączenie odpowiedzialności
Informacje i publikacje przygotowane przez TradingView lub jego użytkowników, prezentowane na tej stronie, nie stanowią rekomendacji ani porad handlowych, inwestycyjnych i finansowych i nie powinny być w ten sposób traktowane ani wykorzystywane. Więcej informacji na ten temat znajdziesz w naszym Regulaminie.